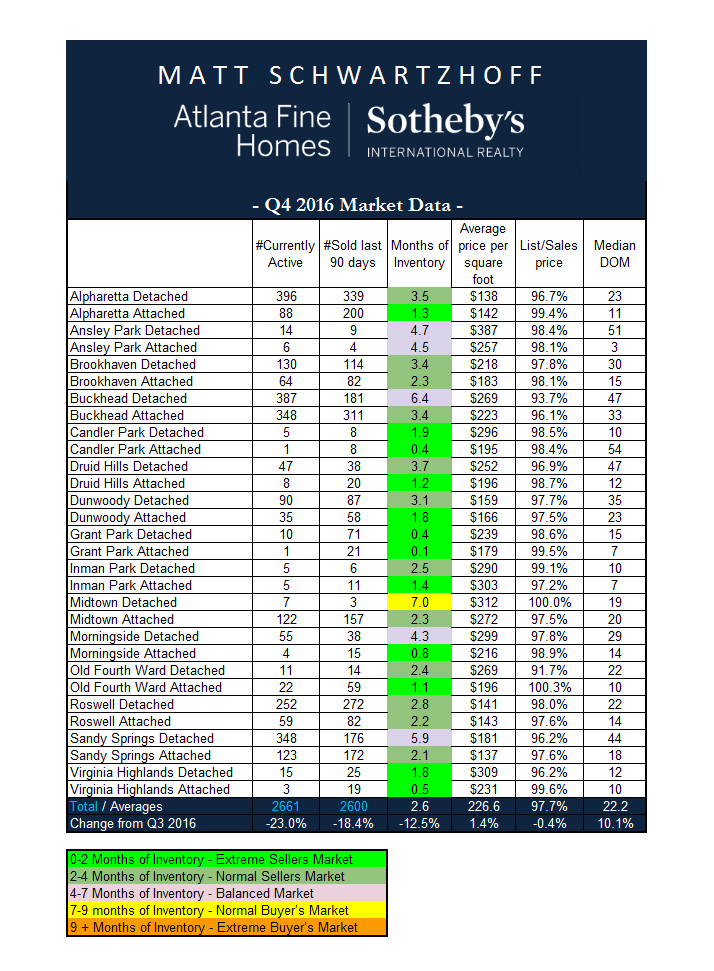
Q4 was another strong quarter for the Atlanta real estate market. While market seasonality* did impact some metrics, we continued to see a healthy increase in prices per square foot and very strong average sales-to-list-price ratios. Here are a few highlights from our Q4 market analysis.
• Compared to Q3, prices per square foot rose 1.4% in the 15 communities we track.
• The average sales-to-list-price ratio during this period remained roughly the same at 97.7%.
• While the median days-on-market for these same communities did increase 10% (from 20 to 22 days), this is almost certainly due to seasonality and is still impressively low in either event.
All 3 of these metrics continue to indicate a strong market for sellers. With almost a 98% sales-to-list-price ratio, sellers didn’t have to discount much at all in order to sell their homes. In fact, hot areas like Grant Park and Inman Park were once again closing in on 100% which indicates intense competition in these neighborhoods.
Overall, despite the slowdown that occurs every year during the fourth quarter, all of the metrics below continue to suggest that 2017 is shaping up to be another strong year for the Atlanta real estate market and we expect to see continued growth in prices per square foot as well as below average days-on-market.
*The sharp decrease in the amount of homes that are currently active and the total amount sold during Q4 are the result of seasonal fluctuations that occur in most real estate markets during the holidays. We expect these numbers to rebound in the coming months.
Note: “Average months of inventory” is how long it would take the market to absorb all currently listed homes given the sales pace that occurred during the preceding 90 days. This metric is often used as a general indicator of whether we’re in a Seller’s or Buyer’s market. For reference, most economists believe that a balanced market (one that doesn’t favor the buyer or seller) occurs when there’s between 4 and 7 months of available inventory.
You can view additional information on each of the 15 markets we monitor below, and if you have questions about the value of your home or trends in your neighborhood, feel free to touch base any time – I’d be happy to help!
Considering buying or selling a home? Here are a few resources and related articles:
Seller Resources
Seller Resources
How to Get the Most for Your Home – Part 1: Preparation
Atlanta Real Estate Predictions for 2017
Why Photography is so Important in Atlanta’s Real Estate Market
Dear Real Estate Agent, What Were You Thinking? How to NOT sell your home…
How to Get the Most for Your Home – Part 2: Positioning and Promoting your Home
Buyer Resources
First-time Homebuyer’s Guide
Atlanta Homebuyer FAQs
5 Tips for Buying a New Construction Home
Atlanta Real Estate Predictions for 2017
Are You Being Watched? …Buyers Beware


